Atmosphere Comparison
Under Construction
This page is incomplete.
Atmosphere Model Temperature Comparison
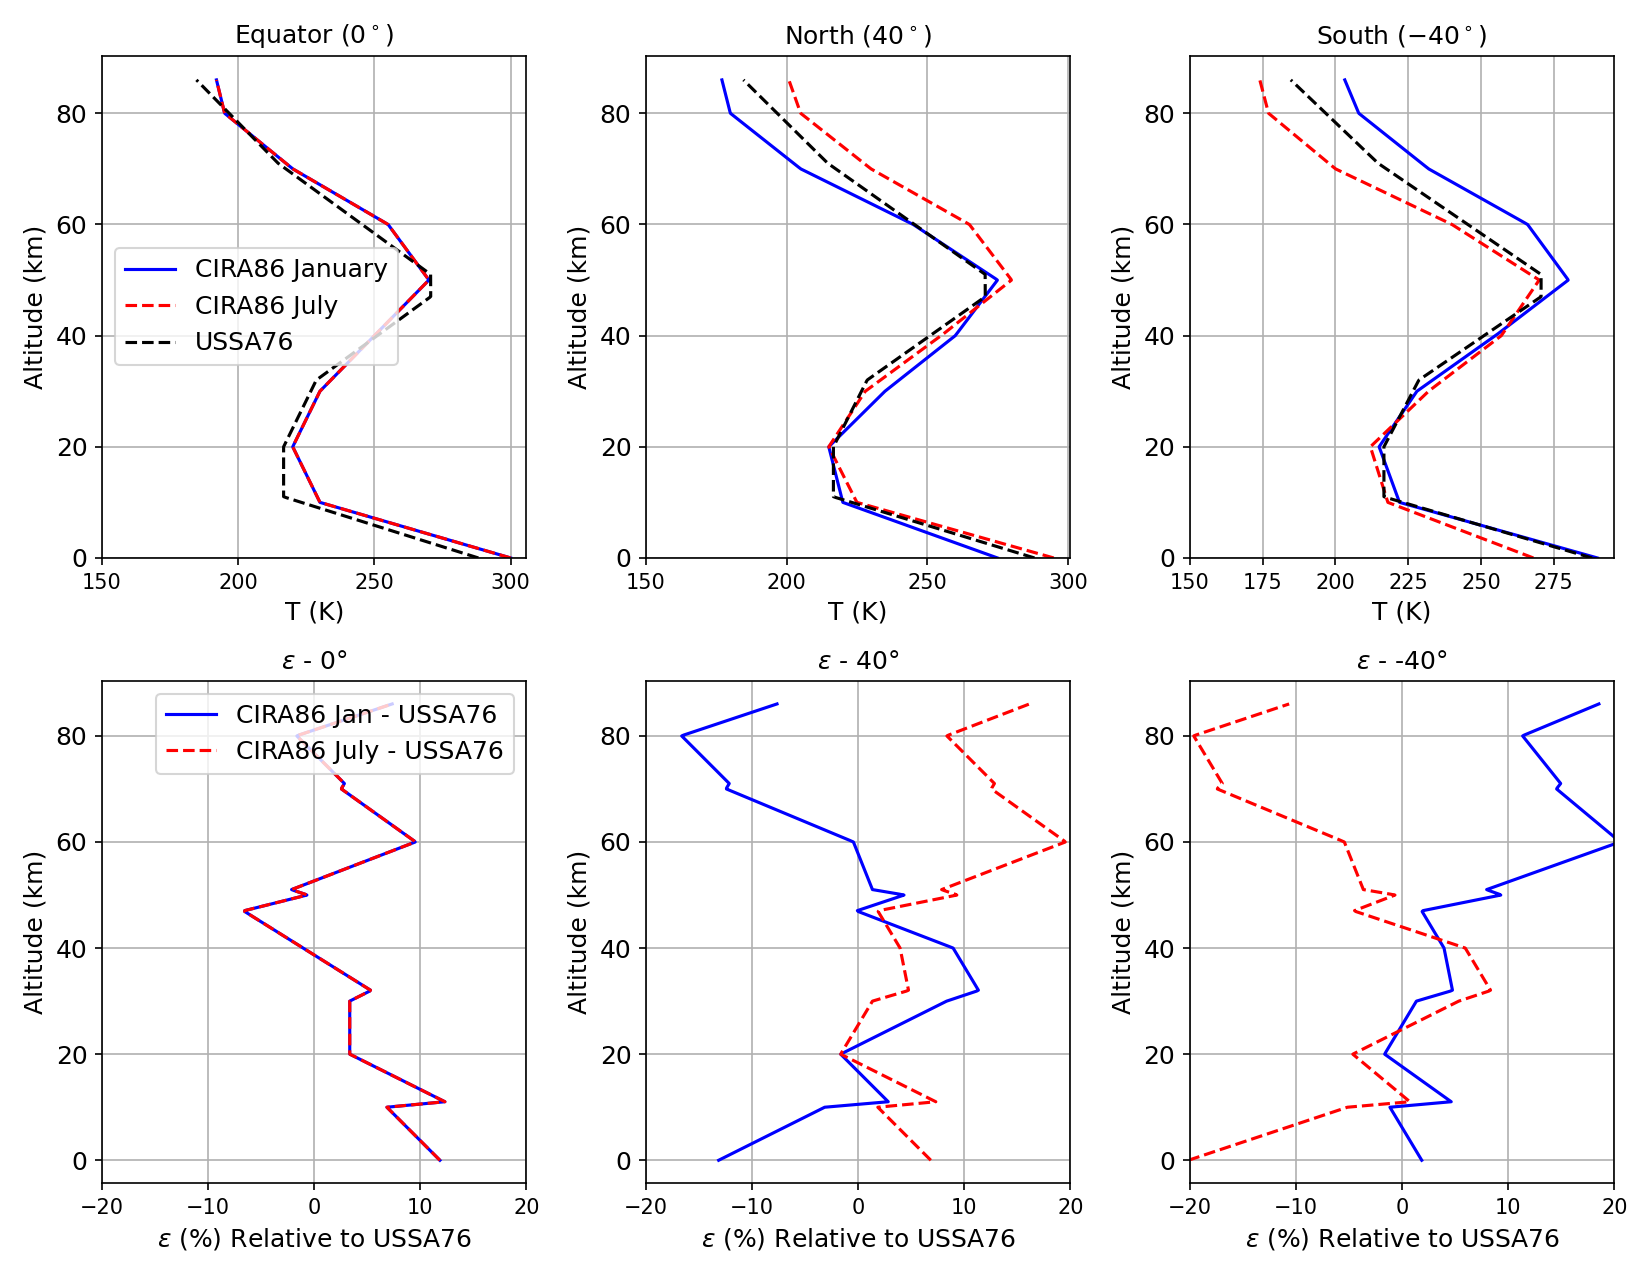
The temperature profiles from USSA76 and CIRA86 exhibit consistent overall behavior, indicating agreement in general atmospheric structure. However, noticeable differences appear at higher latitudes, particularly in the upper atmosphere, where seasonal effects cause larger deviations. The error plots show that CIRA86 can both overpredict and underpredict temperature relative to USSA76 depending on altitude and latitude.
Atmosphere Model Density Comparison
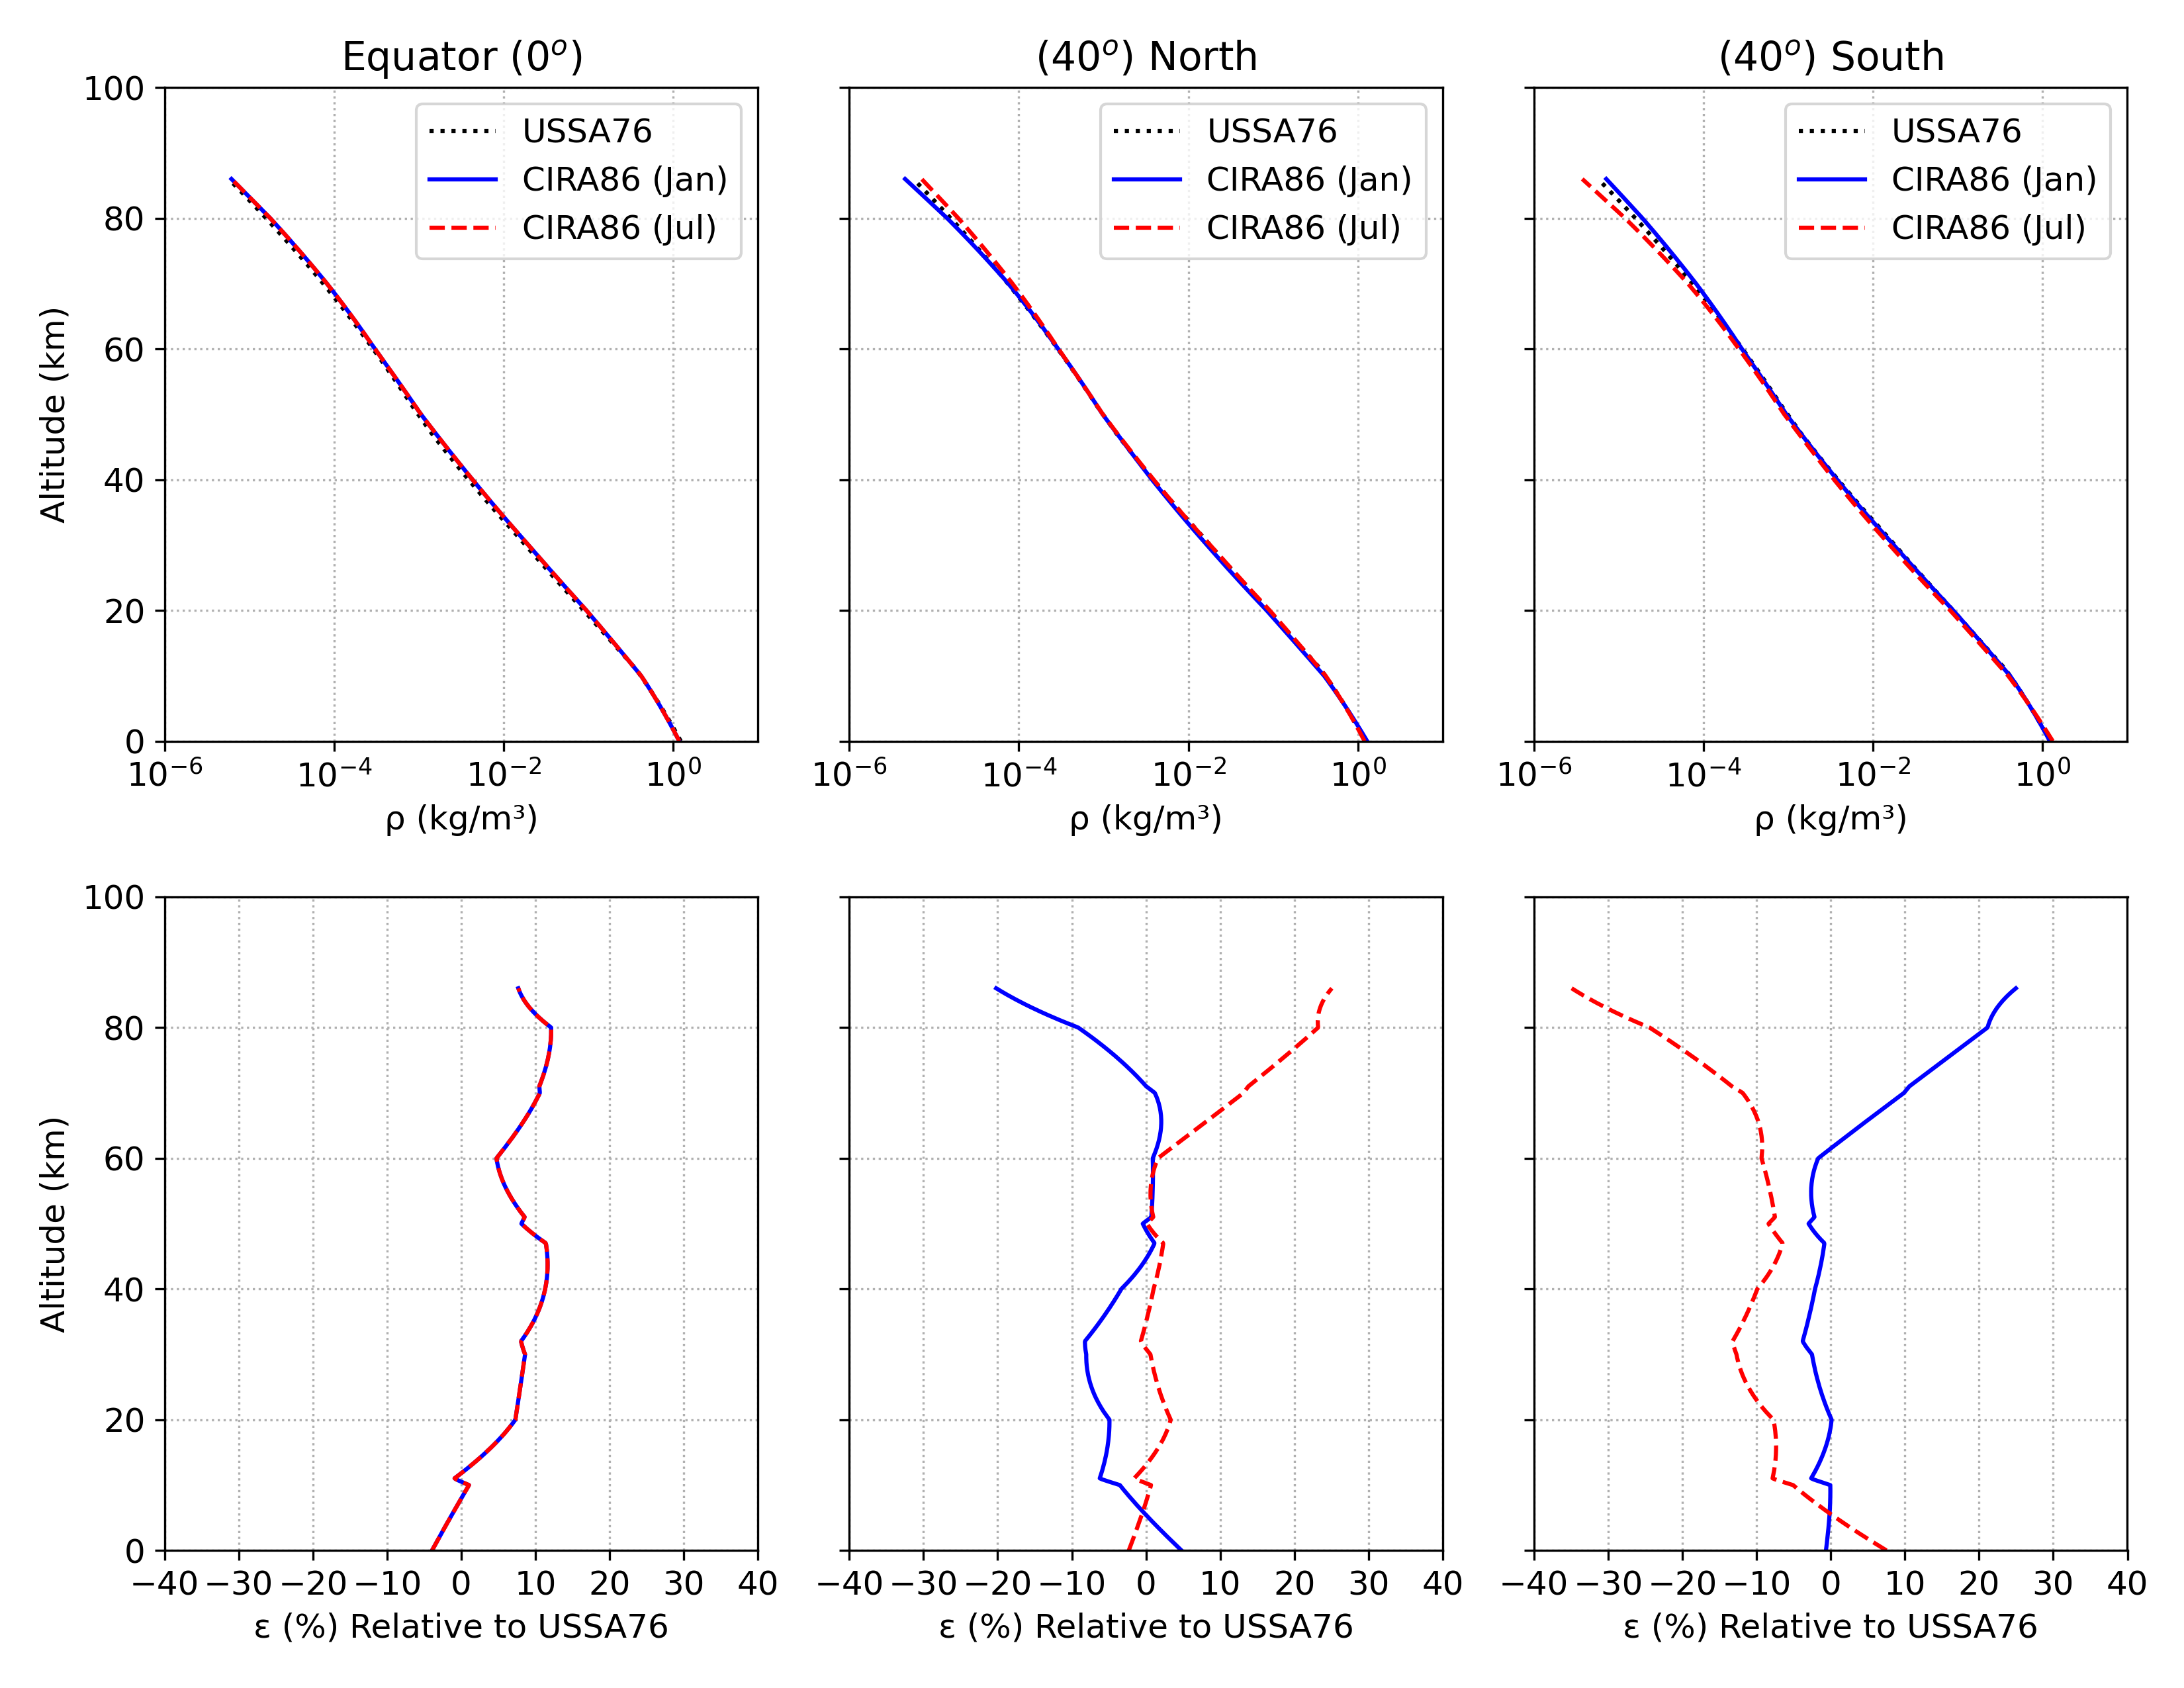
The density profiles of the USSA76 and CIRA86 models are virtually indistinguishable in the lower and middle atmosphere, accurately capturing the expected exponential decay and ensuring solid dynamic pressure calculations for standard low-to-mid altitude analyses. However, noticeable divergences emerge in the upper atmosphere. Because atmospheric density is linked to temperature, the seasonal and latitudinal thermal variations introduced by CIRA86 compound at higher altitudes to affect local density. The overall change in density is negligible in calculations.
Reproducing These Plots
The figures were generated with:
Sample Trajectory Calculation
Sample Trajectory 1: HIFIRE-1 Flight Experiment 2007 (Kimmel)
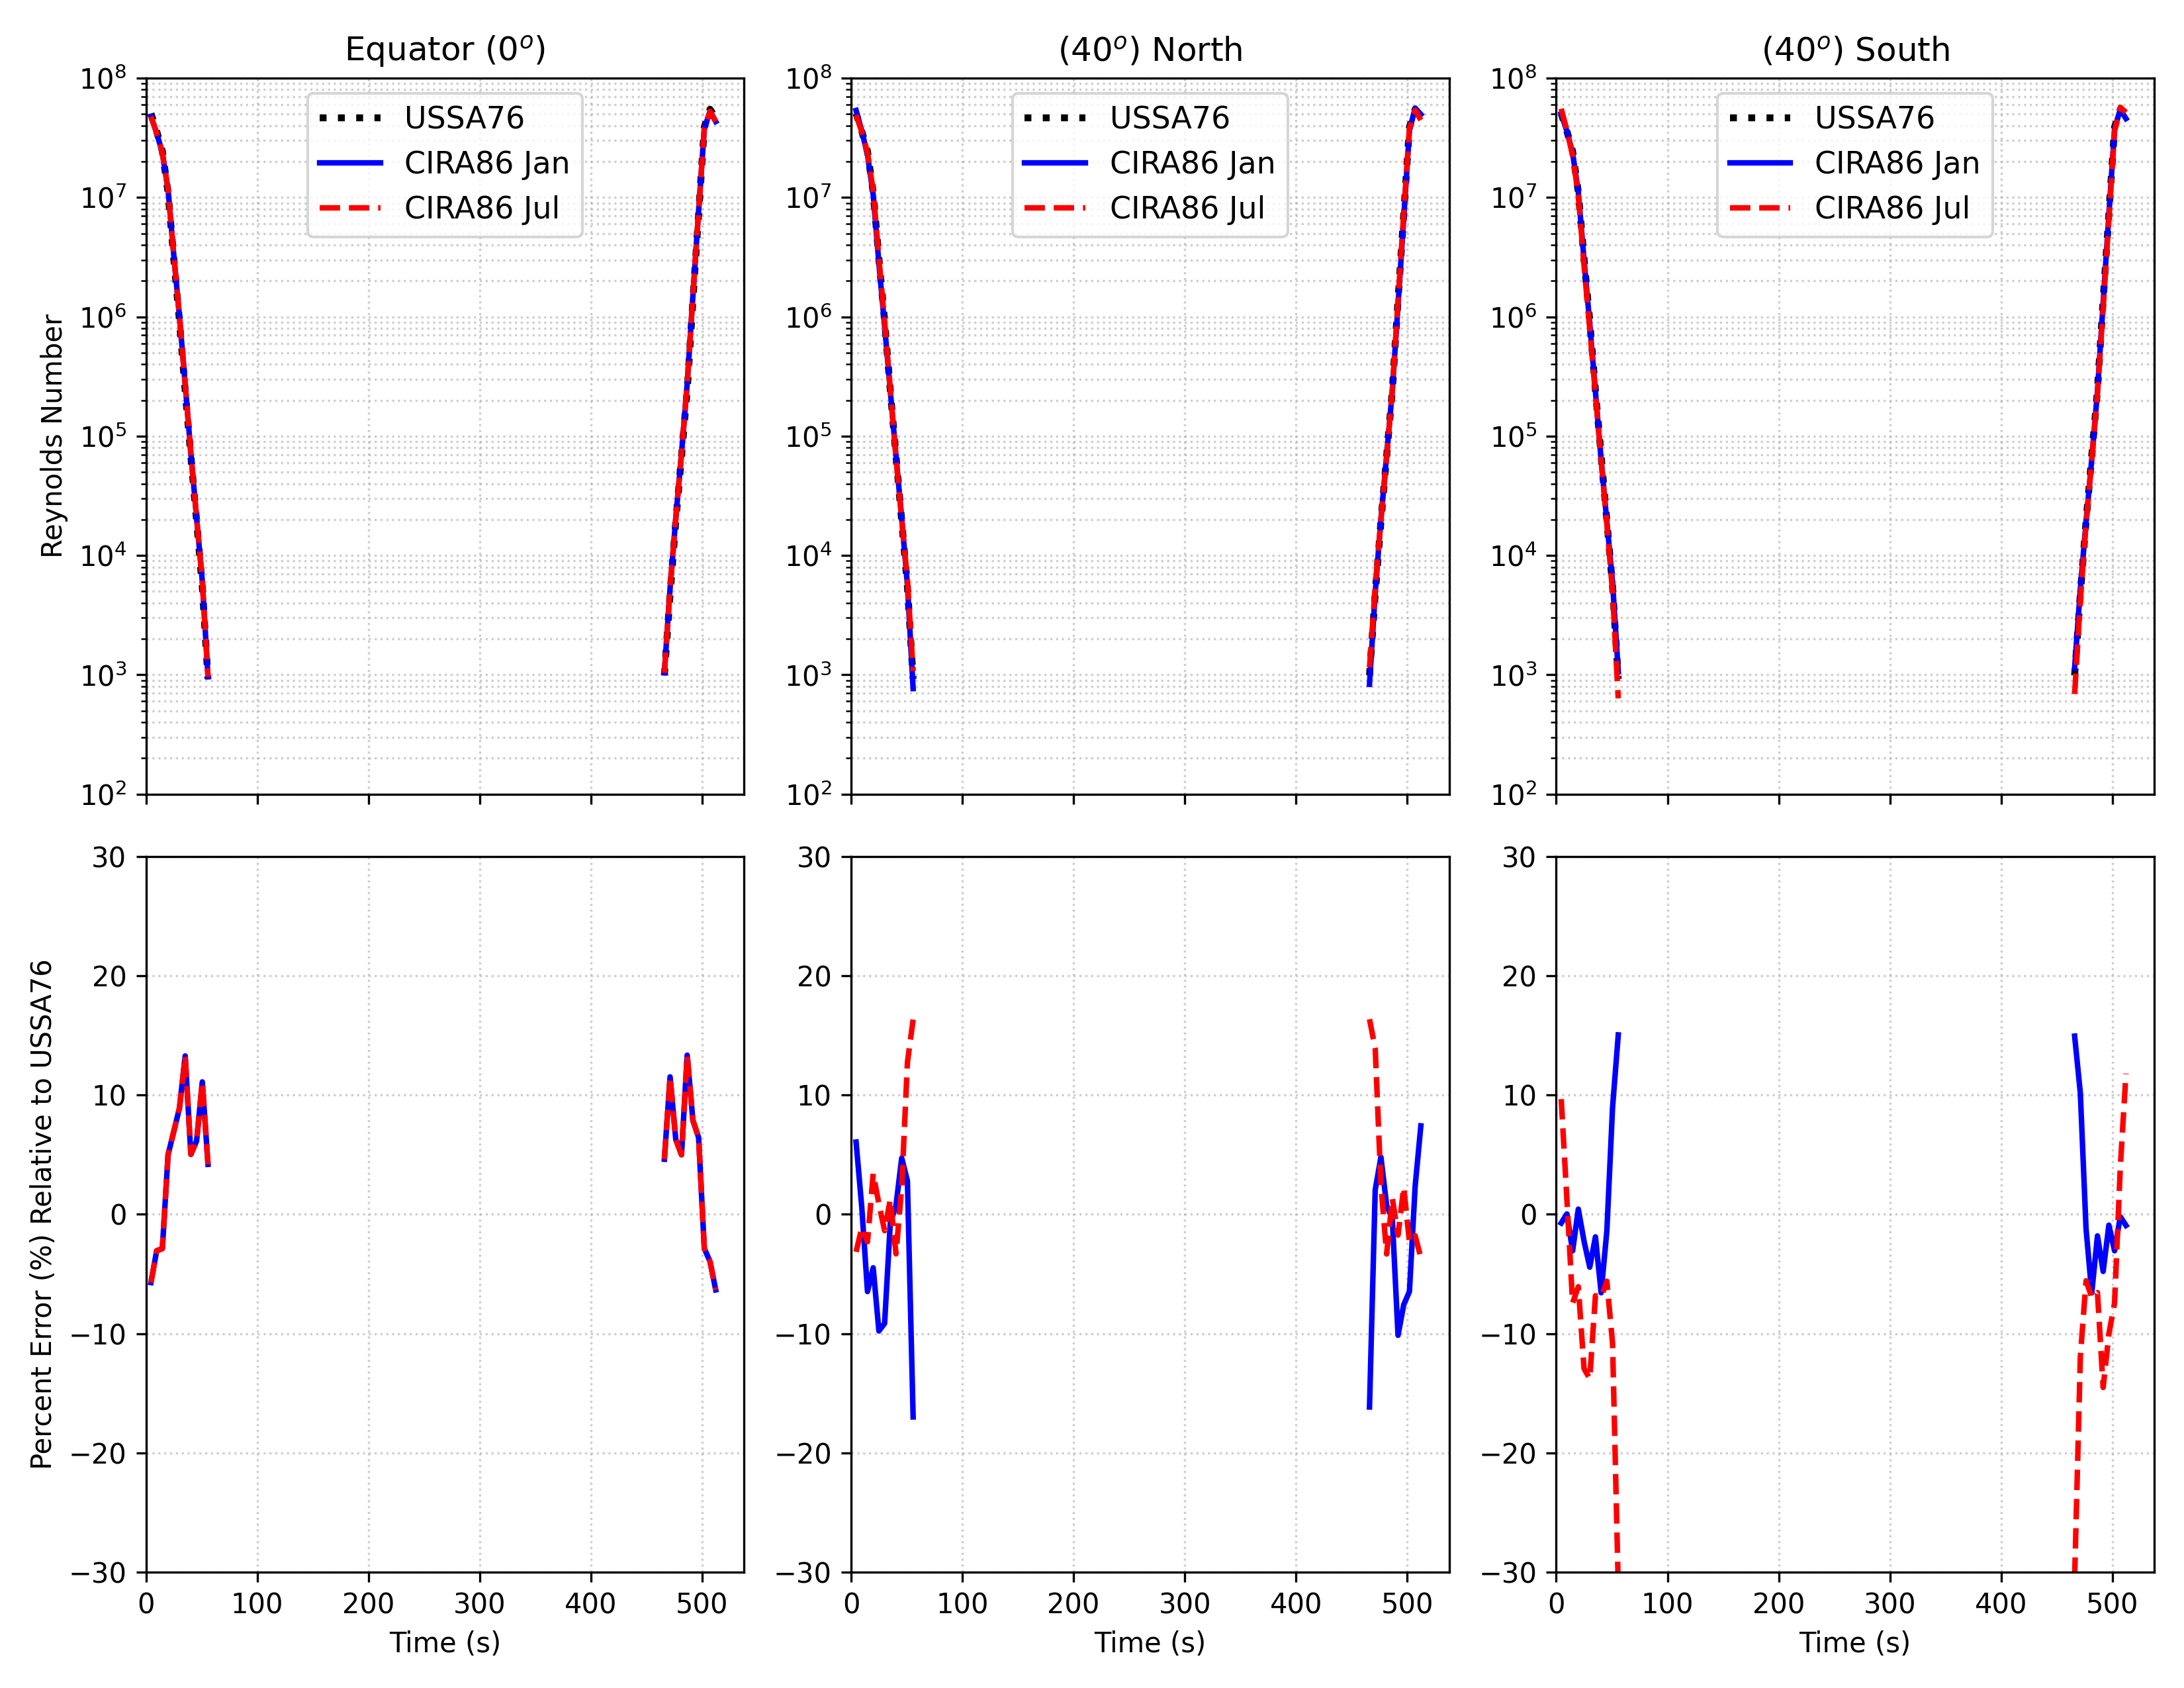
For the HIFIRE-1 sample trajectory, the Reynolds number profiles illustrate the impact of atmospheric model selection on a high-speed, high-altitude flight path. While both models track the same broad aerodynamic envelope, the calculated Reynolds numbers diverge most notably near apogee and during the high-velocity atmospheric descent. These variations are directly tied to the distinct density and temperature gradients each model predicts at extreme altitudes, highlighting the sensitivity of viscous aerodynamic predictions and boundary layer transitions in hypersonic regimes.
Sample Trajectory 2
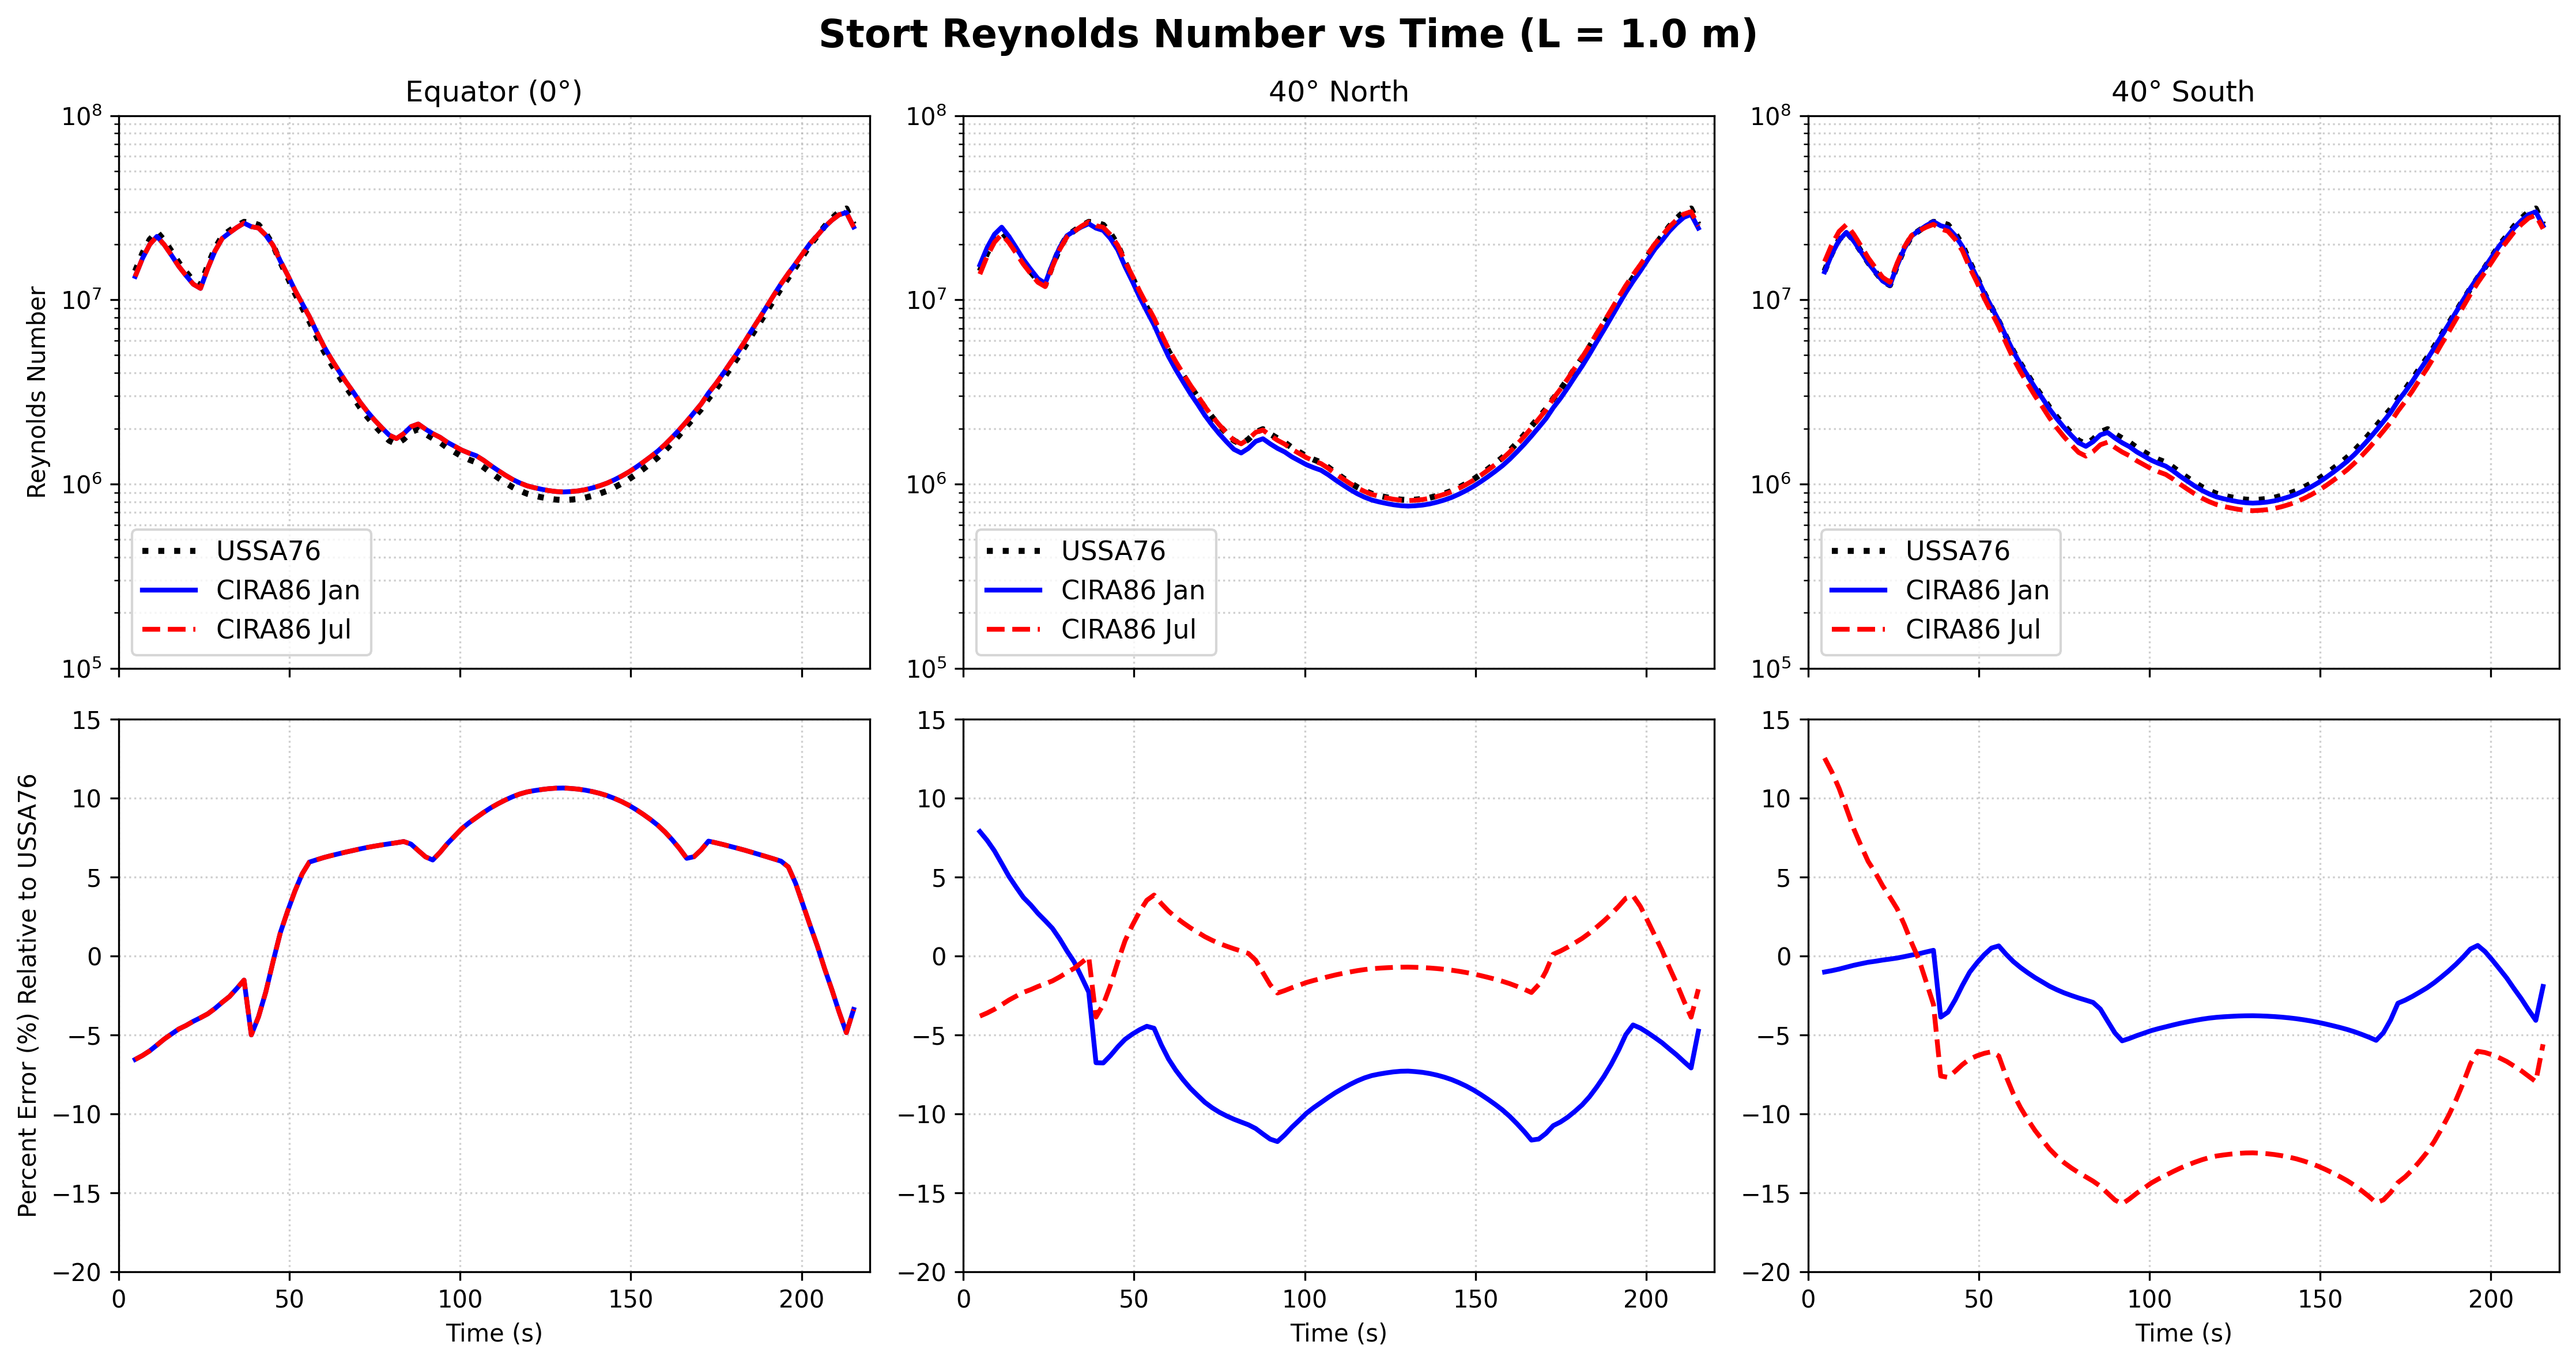
The Reynolds number profiles from the USSA76 and CIRA86 models follow the same overall trend, indicating consistent aerodynamic behavior along the trajectory. Differences between the models are relatively small but vary with latitude and season, with the largest deviations occurring during the mid-trajectory region. These variations reflect changes in atmospheric density and temperature captured by the different models.
The figures were generated with: